Regularization
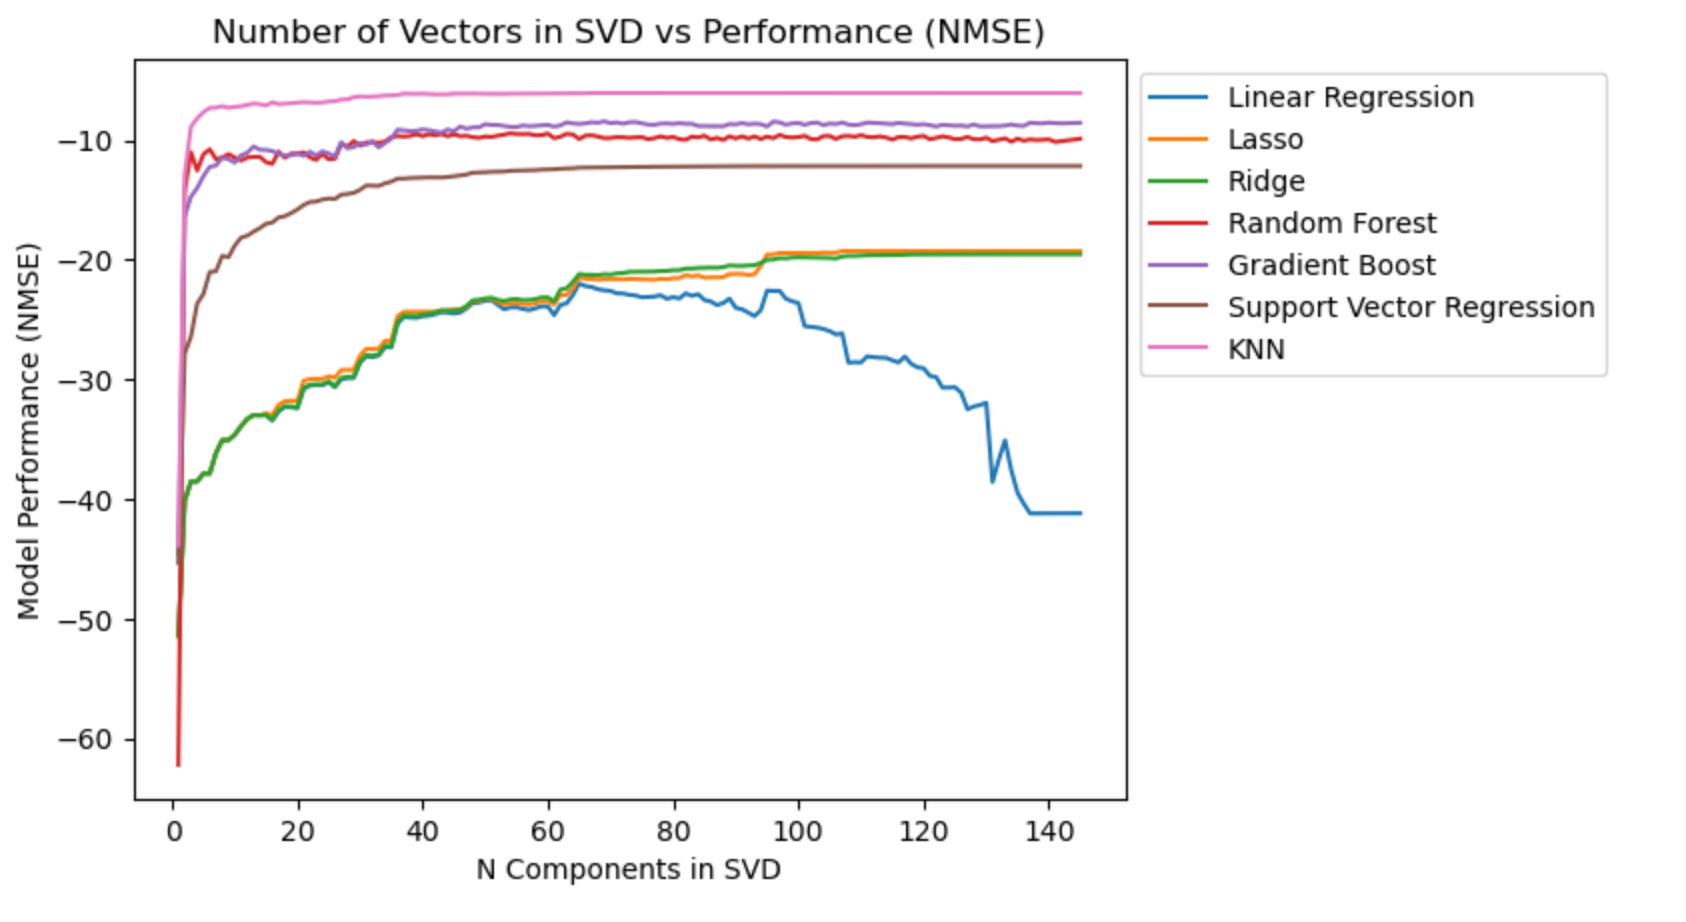
When your regression line whips around like the infamous 2016 NYTimes election predictor needle....

In hindsight, I was able to suss out a handful of insane outliers (like 25 sigma outliers) that were probably typos, and were most likely causing the regression line to whip back and forth like the infamous 2016 NYTimes election needle.
I thought I was dealing with multi-collinearity and simplex group problems only, but lurking in the data the entire time were some special surprises. It took me way too long to figure out what was going on I will never look at a box plot the same way again.
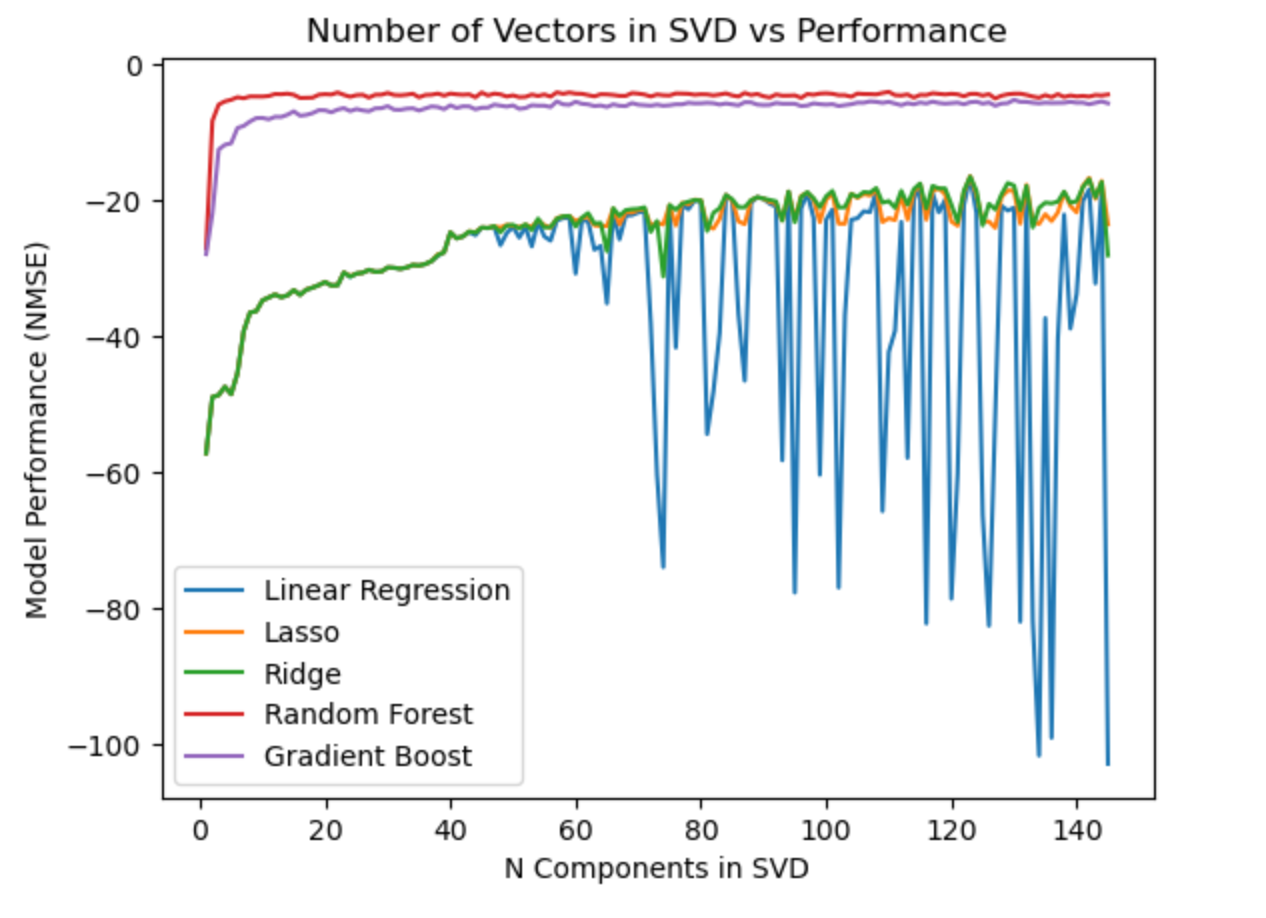
However, even without the insane outliers, the chart is still pretty:
All is well that ends well, however. Even if it took me way too long to find the real cause of instability in my models, I was able to come away with the most amazing regularization chart ever made: