Women's Labor Force Participation vs. Fertility
Ross Douthat writes that women tend to go on strike, when society expects them to have children and a career. And they go on strike, not by demanding better working conditions, which might be more conducive to having children; they go on strike by refusing to have children.
In his excellent book, The Decadent Society, Ross Douthat observes that women tend to go on strike, when society expects them to have children and a career. And they go on strike, not by demanding better working conditions, which might be more conducive to having children. They go on strike by refusing to have children.
Douthat's observation feels true to me. I was raised to be a career woman, and many of my friends are career woman. Dozens if not hundreds of time, I have heard women say they would like more children, but the costs are too high. On the surface, this seems to be an argument about cost of living, rather than gender roles, but these women are high earners often from elite families with few dollar-cost constraints. Instead, I think, they mean cost in terms of career.
I wanted to see if Ross Douthat's claims were borne out in the data. Now that I am a data scientist, I have all of the tools at my fingertips, and I am limited only by my own imagination, and the availability of data, of course. So I got the data, I munged it, and I made these beautiful charts that you see here. It turns out that Douthat is right, mostly. Women do seem to have fewer children, as they enter the labor force. But that is not the whole story. A few other interesting findings emerged.
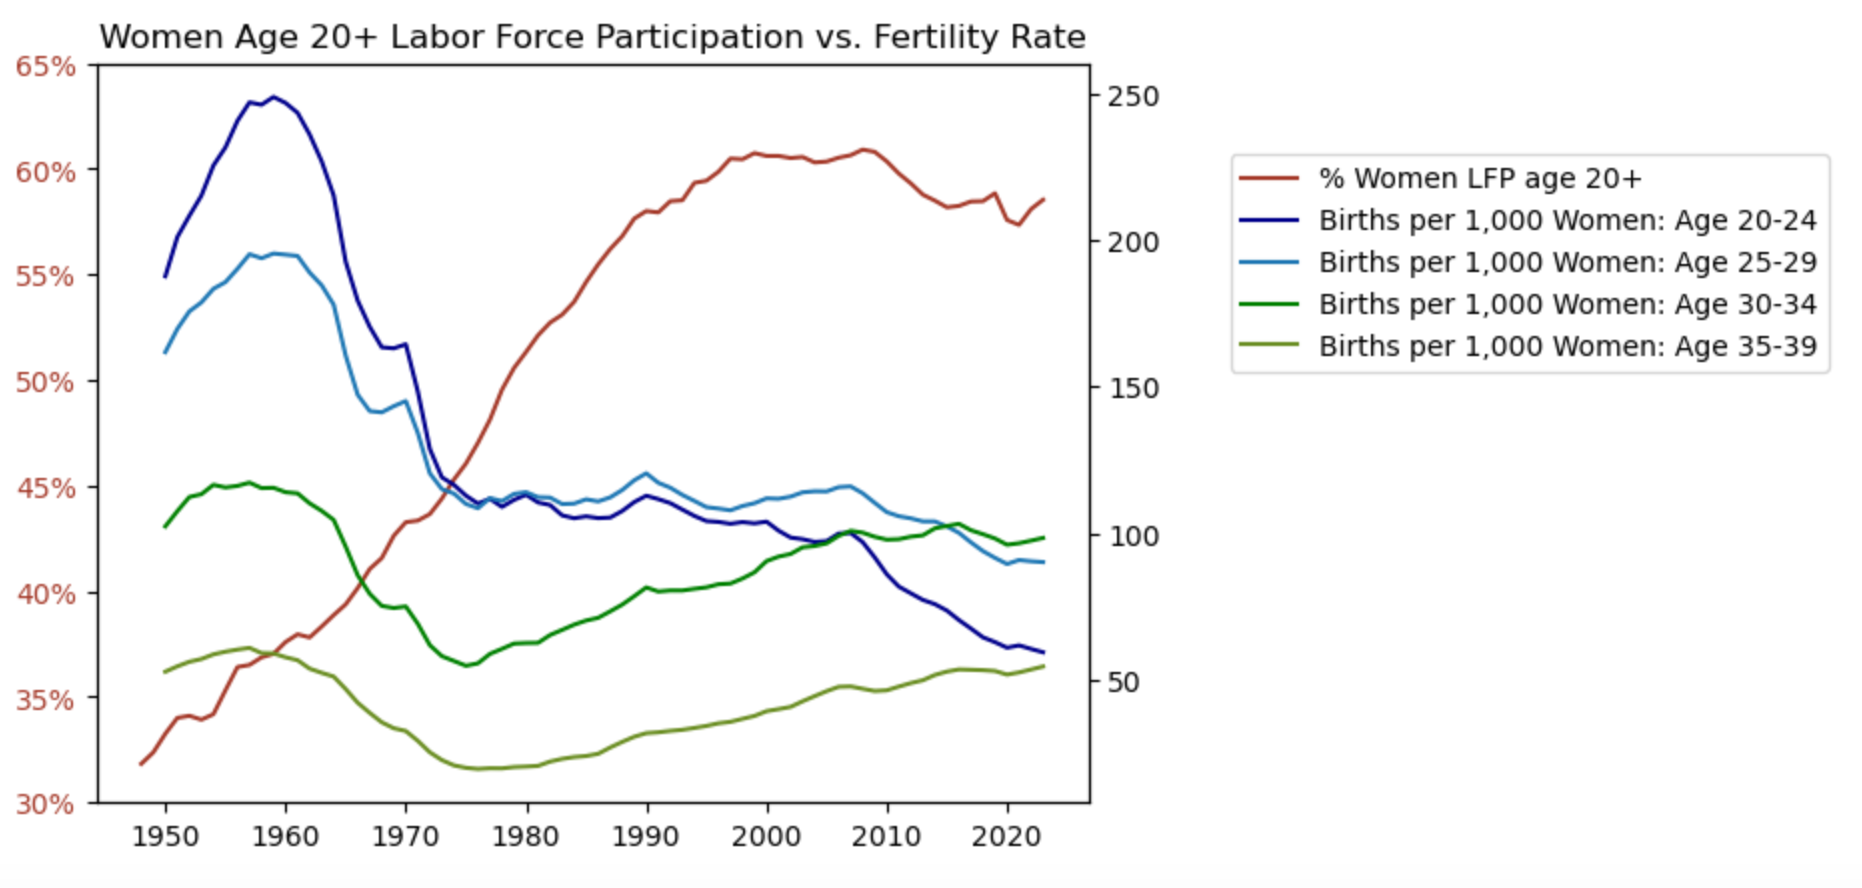
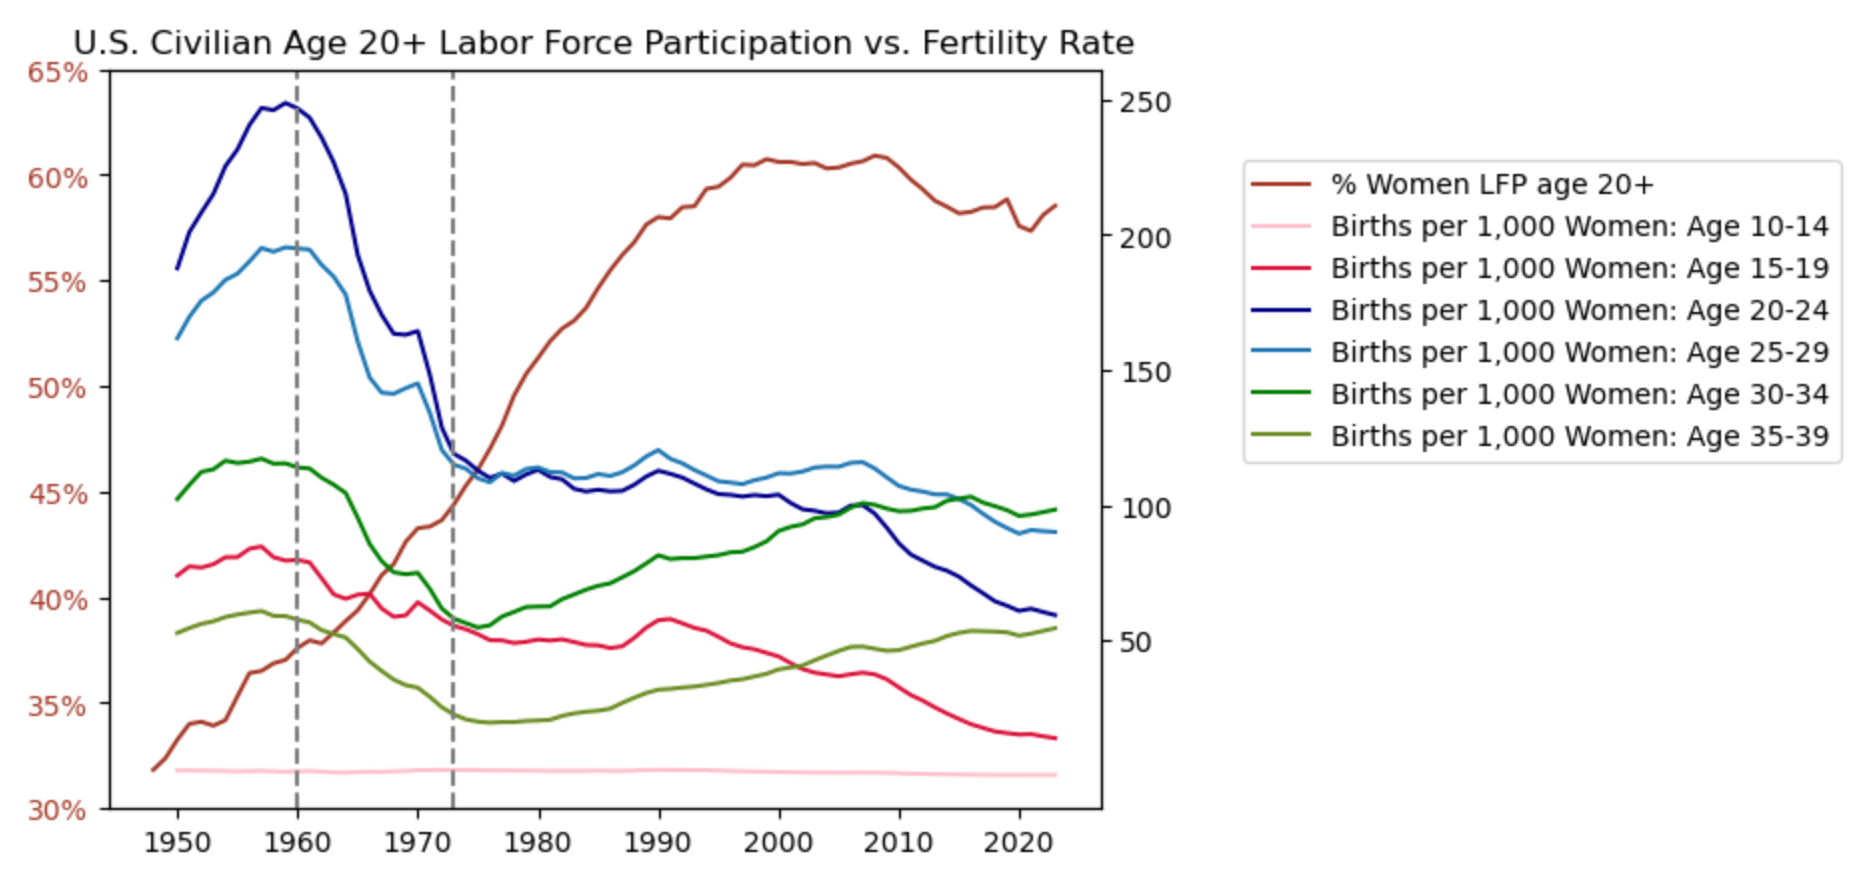
First of all, if you look at the chart above, it's pretty starkly clear that fertility rates have dropped precipitously as labor force participation has increased. However, between 1950 and 1960, women's labor force participation and fertility rates increased in tandem. So, why did fertility rates take such a massive and obvious plunge around 1960? Well, take a wild guess!
According to the American Medical Association, the FDA approved oral contraceptives, also known as "the Pill," in 1960. I think it's fairly clear: There is an unmistakable trend inversion and inflection point in the fertility data in 1960. However, it is clear that fertility growth was slowing even before the pill became widely available, which would be in keeping with Douthat's hypothesis: As women entered the labor force and gained some financial independence, they began to do some family planning.
If family planning was already happening before oral contraceptives became available to the public, it's clear that the pill was a "game changer." It's not everyday you see a line chart with such an obvious catalyst in the data. Every woman knows that contraceptives are a big deal. Labor force participation picks up steam at the same time that fertility plunges (see the change in convexity), but it was very clearly increasing regardless of babies, prior to 1960.
The next obvious inflection point in fertility comes in the mid 1970's. Interestingly, this is when fertility rates for women in their thirties begin to increase, albeit modestly, even as labor force participation increases in tandem. It is only younger women whose fertility rates continue to decline. So what happened in the mid 1970's? Roe vs. Wade passes in 1973, which may account for the continued decrease in fertility among relatively young women (women in their twenties).
Here is the chart with women and girls in their teens. I have excluded these lines from the previous charts, as my goal was to focus on career-aged women, and the relationship between fertility and career. However, one can argue that women who have abortions in their teens are thinking about their future careers. You can see that the trends are the same for these women as with their 20's peers. The point remains that women in their thirties began having more children after Roe, rather than fewer children.
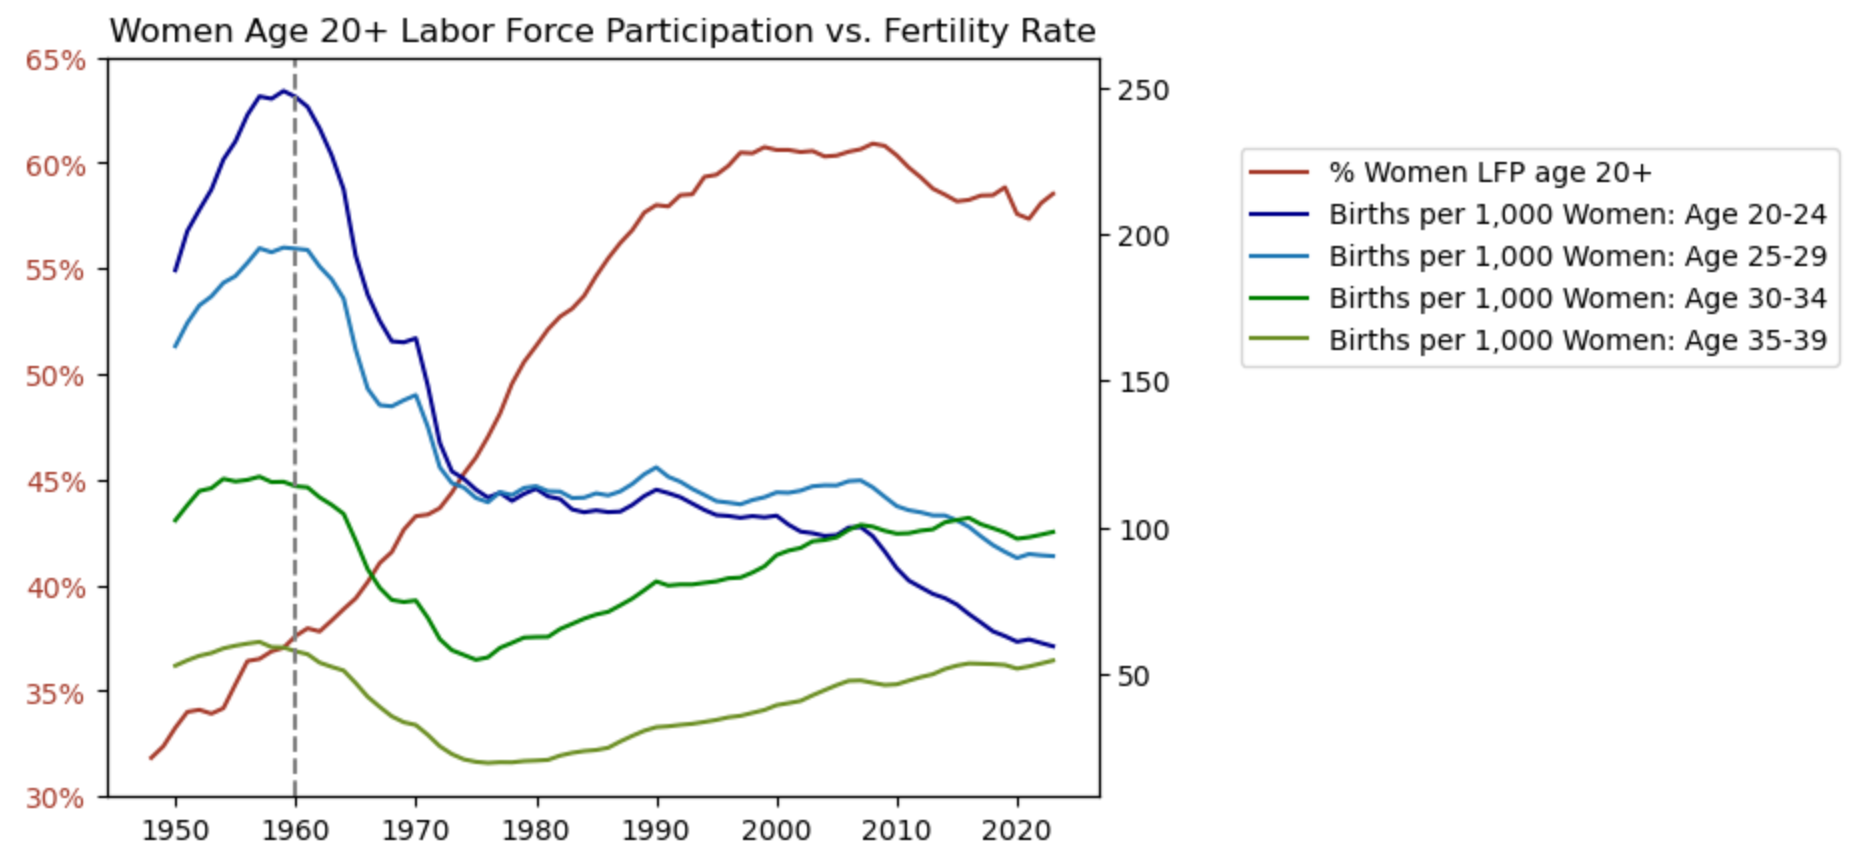
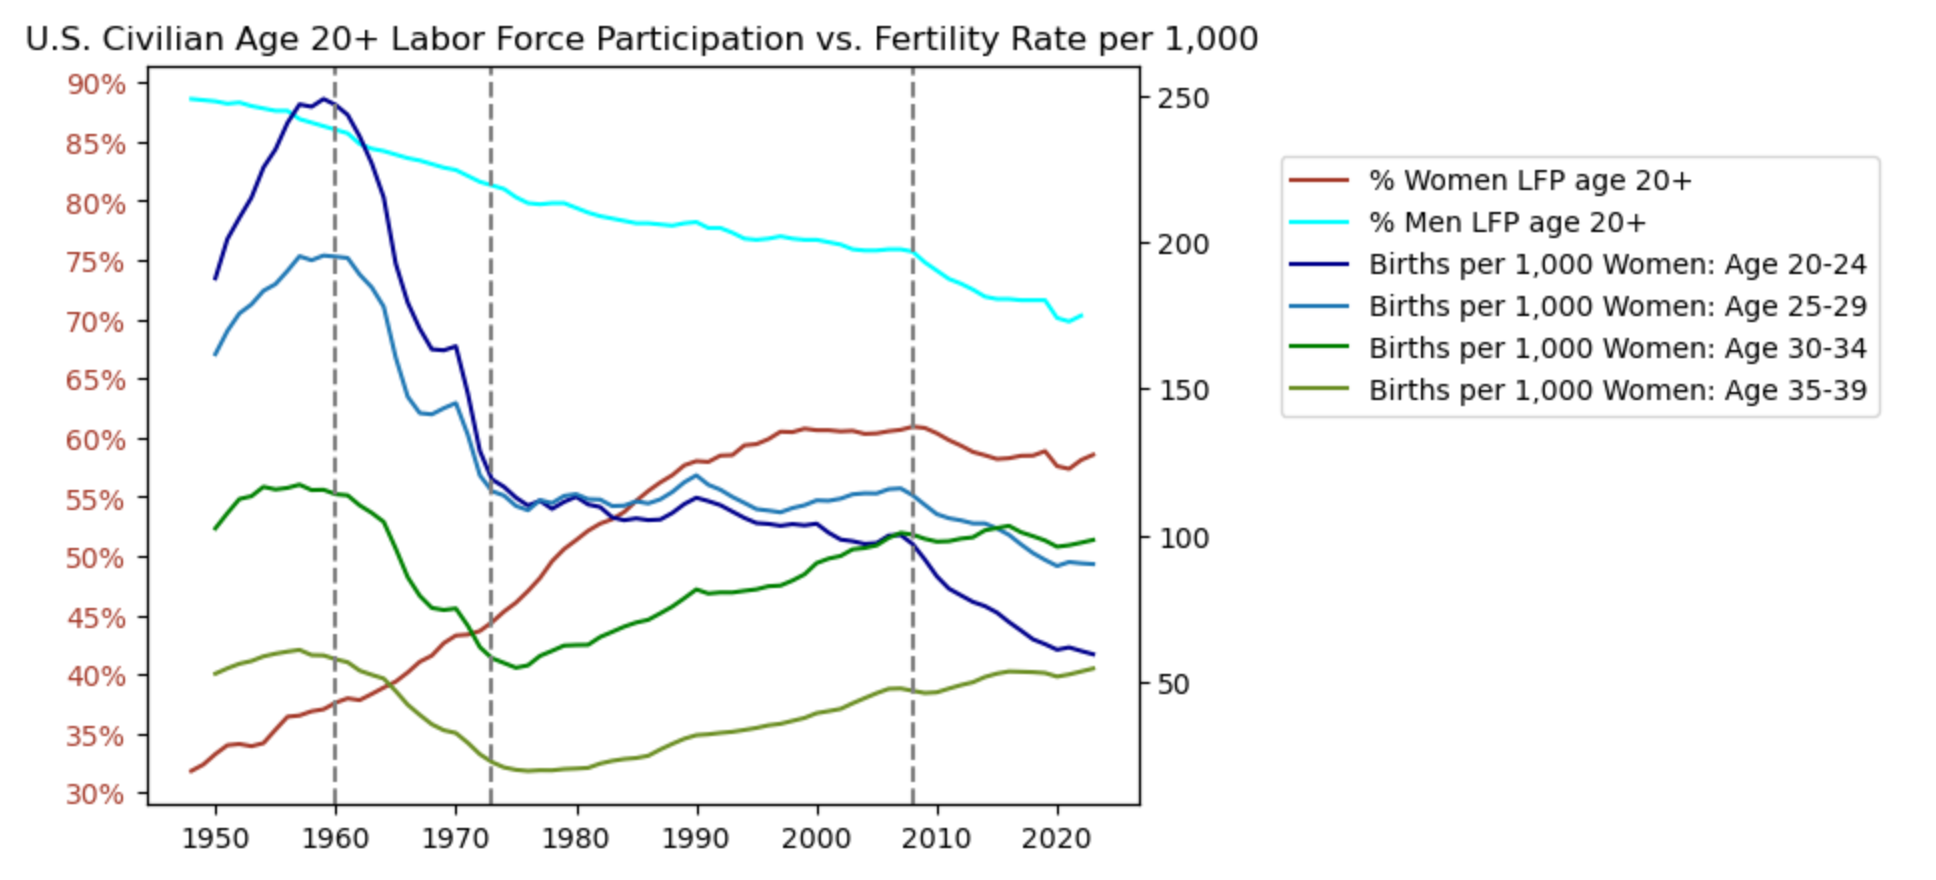
2008 marks another catalyst, which is subtler than the other two (I have added another dashed line). In 2008: Women's labor force participation begins to stall, and actually declines, while fertility rates for women in their thirties continue their inexorable upward but slow march. Fertility decline among women in their 20's steepens its downward slope. Are women in their 30's leaving their careers to become mothers, then? If you look at men's labor force participation in 2008, it has the same downward trend, so it would seem that it's not just women dropping out. (You can also see a notable blip in 2020, which of course, was Covid).
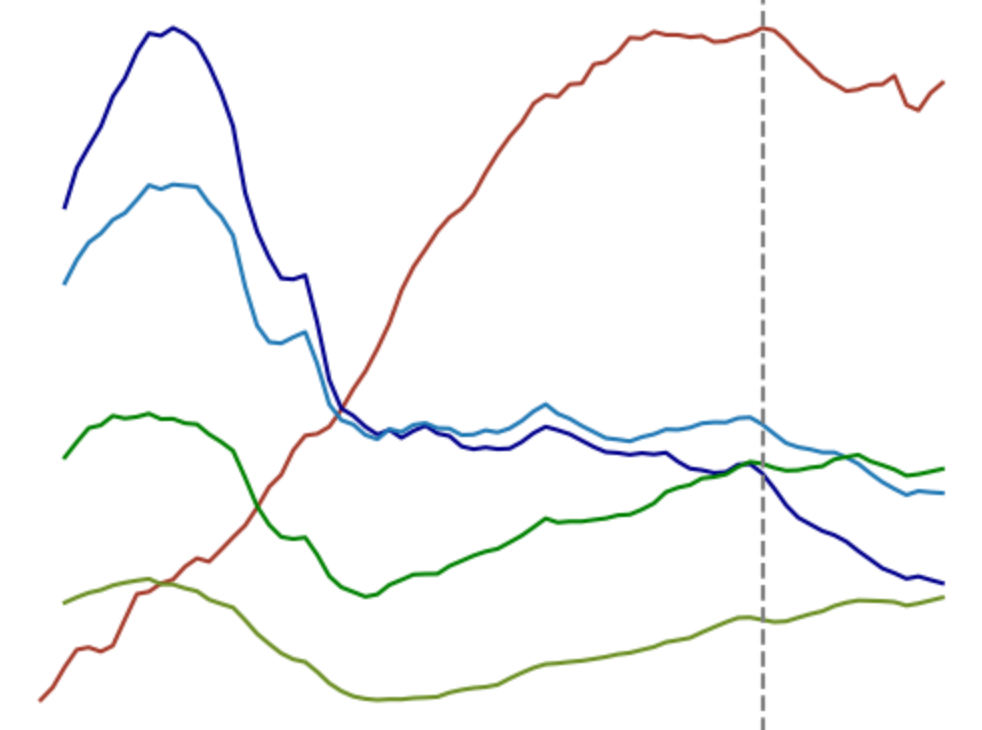
If we add men's labor force participation into the picture, we see that men also began dropping out of the workforce in 2008, and their participation number have only declined since then. It is possible that many of these men are dropping out of the workforce to be stay-at-home dads. Unfortunately, we don't have the granularity in the BLS data to assess that (more on this in the next section). However, there is also the issue of an aging workforce, and many people may be dropping out due to age.
So, what can we conclude about Ross Douthat's statements from The Decadent Society? If I were a fact checker, I would say that Douthat is largely right, but not 100% correct. Largely correct is good enough for making a broad factual claim, in my view. If the standard of veracity for any statement were 100% truth, nobody would be able to say anything, ever..
It does appear that career women have gone on strike, so to speak, when it comes to having babies. Women in their early twenties, especially, are having one fifth of the number of kids, which they used to have at their peak fertility. However, women in their thirties have practically regained their peak fertility rates. Unfortunately, peak fertility rates for women in their 30's was always much lower than for younger women. Thus, older women have been unable to compensate for all of the disappearing babies, even though they are no longer on strike.
What has been happening since 2008?
As with all data projects, the question you start with leads to other questions, the most exciting of which, you did not anticipate. After looking at the chart for labor force participation for women and men, it is clear to me that we have a shrinking labor force in America. I know that the population is aging, but that may not be the only thing going on. Men have been leaving the labor force since the earliest years of my dataset. Since 1950, the story of labor participation for men has been a steady decline, all while prime working age cohorts were presumably at peak magnitude.
I do not want to suggest that men "don't want to work anymore," as that is not my hypothesis. Even with the staggering decline in participation for men, men are still in the official labor force much more than women. However, undeniably, men have been leaving the labor force for the better part of a century, and it seems unrelated to the overall age of the country. Where have these men been going? And where are women going, since 2008?
It is possible that all of the increase in fertility comes from women who have dropped out of the official labor force (I am one of them). Unfortunately, the labor force data from the BLS does not come with age cohorts, which would help us determine at least which age of women are abstaining from official employment.
As a full-time mom, I must check the box for "unemployed" when filling out paperwork. I do the taxes for our household, so I am familiar with the basics of taxation, and I understand that being "unemployed" is a tax advantage. If being a homemaker were considered officially employment, my husband would need to pay me a salary for my work, and I would be taxed on it, which would totally destroy our household finances. So I am not complaining about being an unpaid servant.
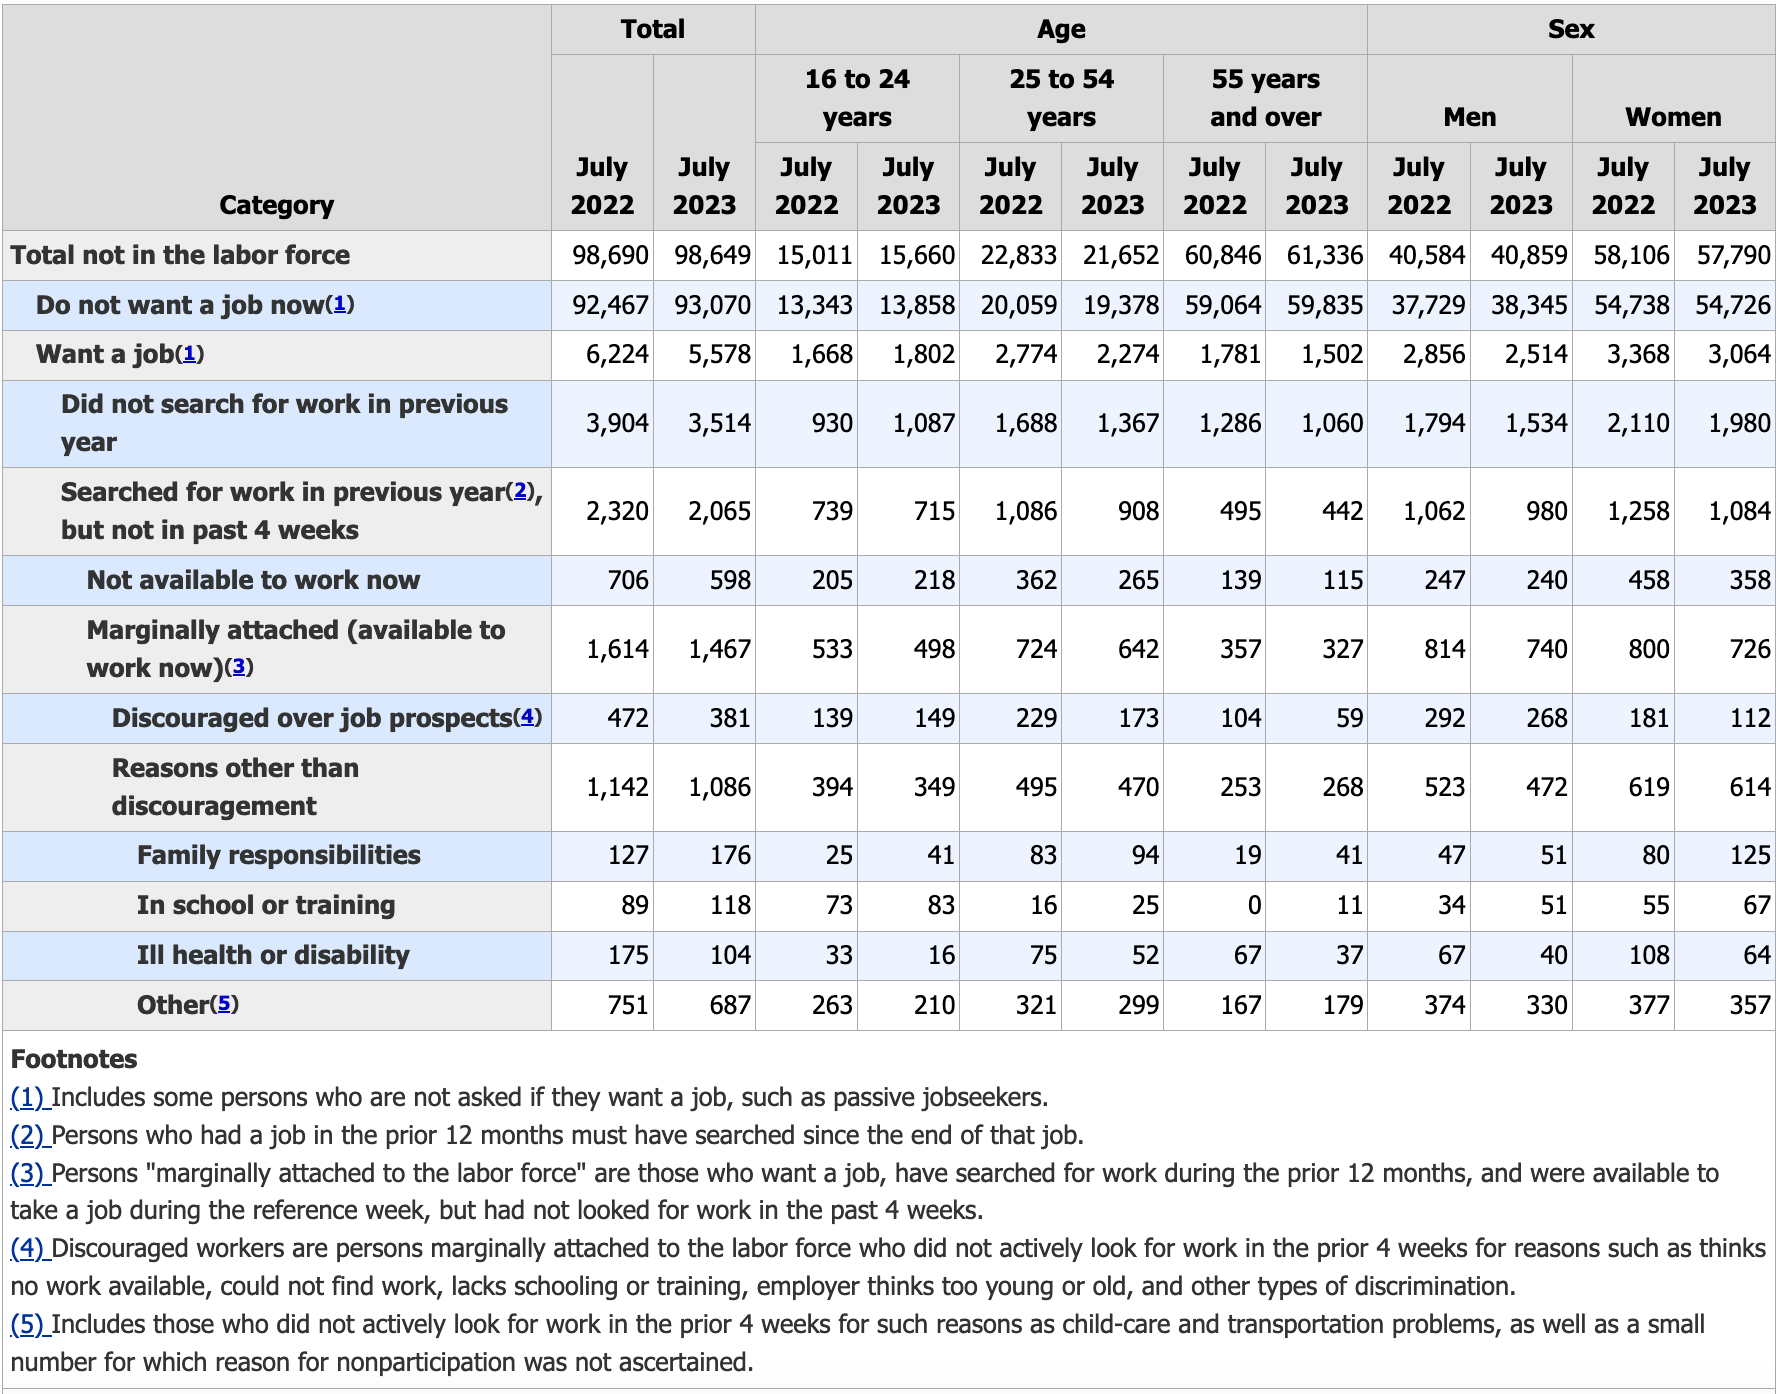
"Labor Force Participation" is defined by the Bureau of Labor Statistics primarily as being working age but not wanting a job, or wanting a job but being unavailable for work. Only people who have looked for a job in the last four weeks are counted as unemployed. Those who have given up looking for work are no longer considered "unemployed," but rather, "discouraged workers," who have dropped out of the labor force. This way of parsing the data makes a lot of sense. People who do not want jobs, like students, are not unemployed.
There is a huge potential for concern, however, if discouraged workers are not counted. And there is a considerable potential for concern if primary caregivers of children are not counted. For the sake of data quality, I do wish that more forms and surveys collected better information about people who have "dropped out" of the labor force.
To be fair, the Current Population Survey does ask those who are "not in the labor force" why they are not in the labor force, "by desire and availability for work." There is a category for "Family Responsibilities," but it is not clear what these family responsibilities are. The technical documentation for the survey, in footnote 5, notes that "child care problems" could fall under the category "Other," rather than under the category of "Family Responsibilities."
The Bureau of Labor Statistics Current Population Survey data, which is where I got the labor for participation data, which I used in this analysis, should collect data on how many folks had "dropped out" of the workforce to provide full-time childcare, explicitly, or full-time elder care, explicitly, as this data would be extremely valuable. Without that granularity of data, it is simply difficult to know where men and women are going, when they leave the labor force.